Analysis And Forecast

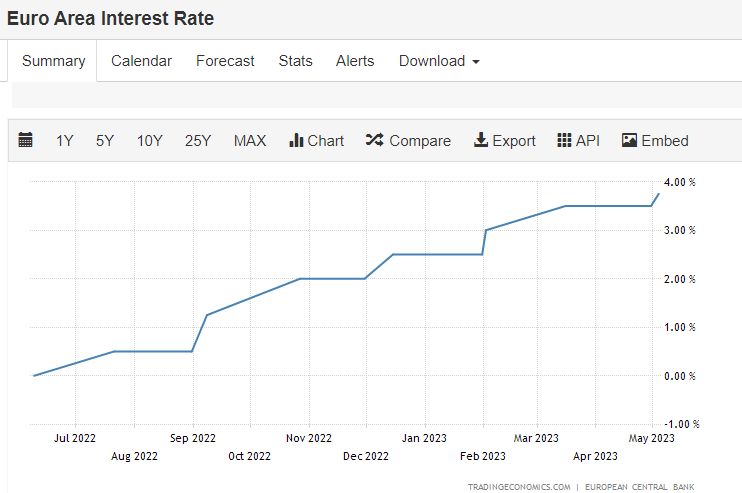
Eurozone inflation is still "too high" and the European Central Bank will keep hiking interest rates but at a more gradual pace, president Christine Lagarde said Thursday.
"We are getting a bit closer to our cruising altitude, not there yet, and that means that we need to continue climbing, but not as rapidly," Lagarde told a banking conference in Hanover. Eurozone inflation fell sharply to 6.1 percent in May, new data showed Thursday, on the back of cooling energy prices. But the figure remains well above the ECB's two-percent target.
"Inflation is still too high," Lagarde said. Moving "at our fastest pace ever", Lagarde said, the ECB has lifted interest rates by 3.75 percentage points since last July.
"There is no clear evidence that underlying inflation has peaked," Lagarde warned, referring to a measure of inflation that strips out volatile food and energy prices.
The ECB will unveil its next monetary policy decision on June 15, with observers pencilling in a rate hike of 25 basis points.
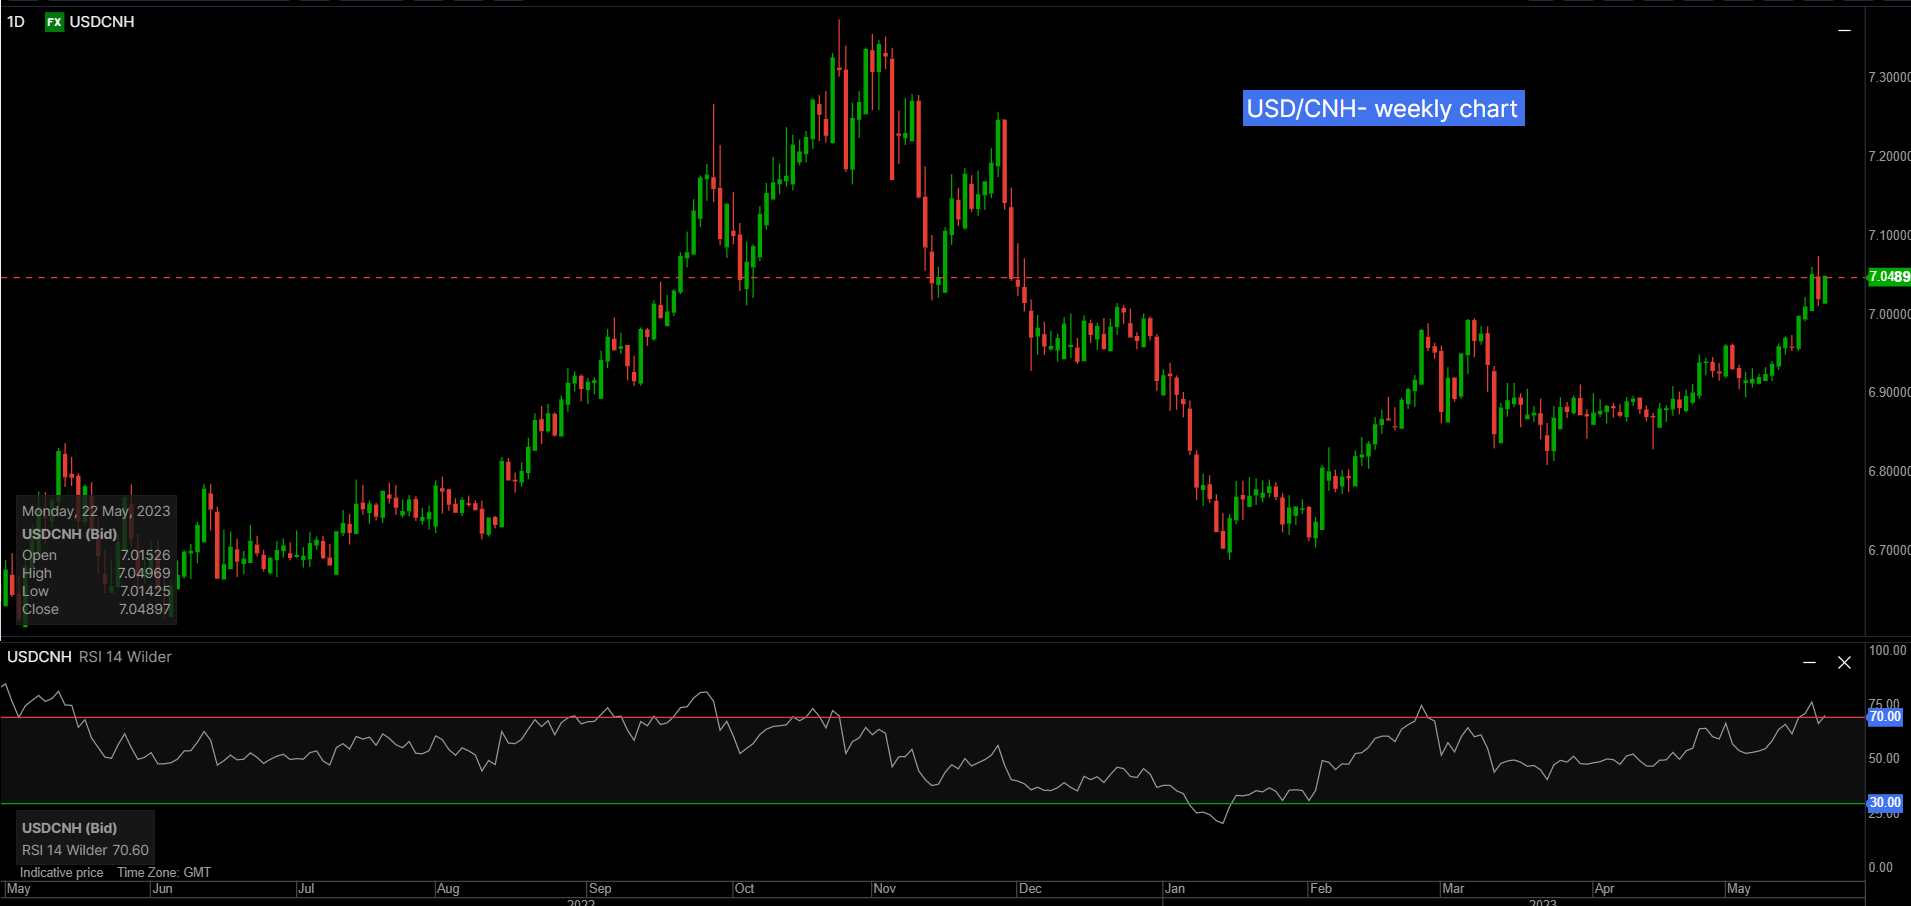
China's failure to reverse a sharp rise in youth unemployment is becoming a bigger headache for Beijing, with many economists saying the problem reflects a jobs mismatch that could defy government solutions for years.
Joblessness among young people aged 16 to 24 rose to a record of 20.4% in April, significantly higher than a few months ago and far above the prepandemic rate of 13% or lower in most of 2019.
The rise was all the more surprising given that urban unemployment overall fell to 5.2% in China as of April, compared with 6.1% a year earlier.
Rather than trade down for lower-wage jobs, many young people are opting to wait for more opportunities, even though such opportunities might not be available.
"China's high youth unemployment rate is not transitory but structural," said David Wang, chief China economist at Credit Suisse. "There is a mismatch in the skills the youth are trained to provide and the skills that existing jobs require."

Gold has been caught in a 1934 – 2049 range for around six weeks and it remains within an ascending trend channel. The lack of short-term direction is characterised by the price clustering near the 10- and 21-day Simple Moving Averages (SMA). A breakout of the range might see momentum build for that direction but notable support and resistance levels lie on both sides.
To the topside, there is a Double Top created by the all-time high of 2075 in April 2020 and the failed attempt to break above it in March 2022 when a peak of 2070 was made. On the downside, the 1885 – 1895 area appears to be a key support zone. Within it lies the 100-day SMA, a previos low, a breakpoint and an ascending tend line.

Our information/charts are NOT buy/sell recommendations. Are strictly provided for educational purposes only. Trade at your own risk and analysis.
Bank of Japan Gov. Kazuo Ueda reaffirmed the bank's stance to maintain monetary easing and warned of the risk of premature tightening.
Japan is finally seeing signs of inflation moving toward 2% and "making hasty policy changes" could ruin such positive developments, Ueda said in a speech Friday.


Crude oil has retreated from stiff resistance at the 82.50-84.00 area, including the 200-day moving average and the January high. See the previous updates highlighting that the OPEC+ output cut announcement did not imply a start of a new uptrend for oil.
Despite the retreat, the bullish gap remains in place – oil is above the lower edge of the gap. In some instances, the closing of a bullish gap negates the immediately prior bullish move, increasing the risk of a downturn in price.
Granted the price action is still unfolding, but on its own, the retreat is not enough to signify that the March rebound is over. A break above 82.50-84.00 is needed for the outlook to turn unambiguously bullish. Such a break would imply that the year-long downward pressure had faded, exposing the upside toward the November high of 93.75.

Natural gas appears to have found some support at the February low of 1.97. Positive momentum divergence on the daily indicates that the multi-month-long slide is losing momentum. Moreover, the daily candlestick charts show the most recent leg lower (from early March) is consolidation within the downtrend, and not the start of a fresh leg lower.
This minor rebound this month on intraday charts is an encouraging sign. Any break above the crucial resistance area around 2.25-2.40, including the 89-period moving average, the 200-period moving average, could open the way toward the March high of 3.03. On the downside, any break below 1.97 would expose the downside toward the 2020 low of 1.45.

Our information/charts are NOT buy/sell recommendations. Are strictly provided for educational purposes only. Trade at your own risk and analysis.