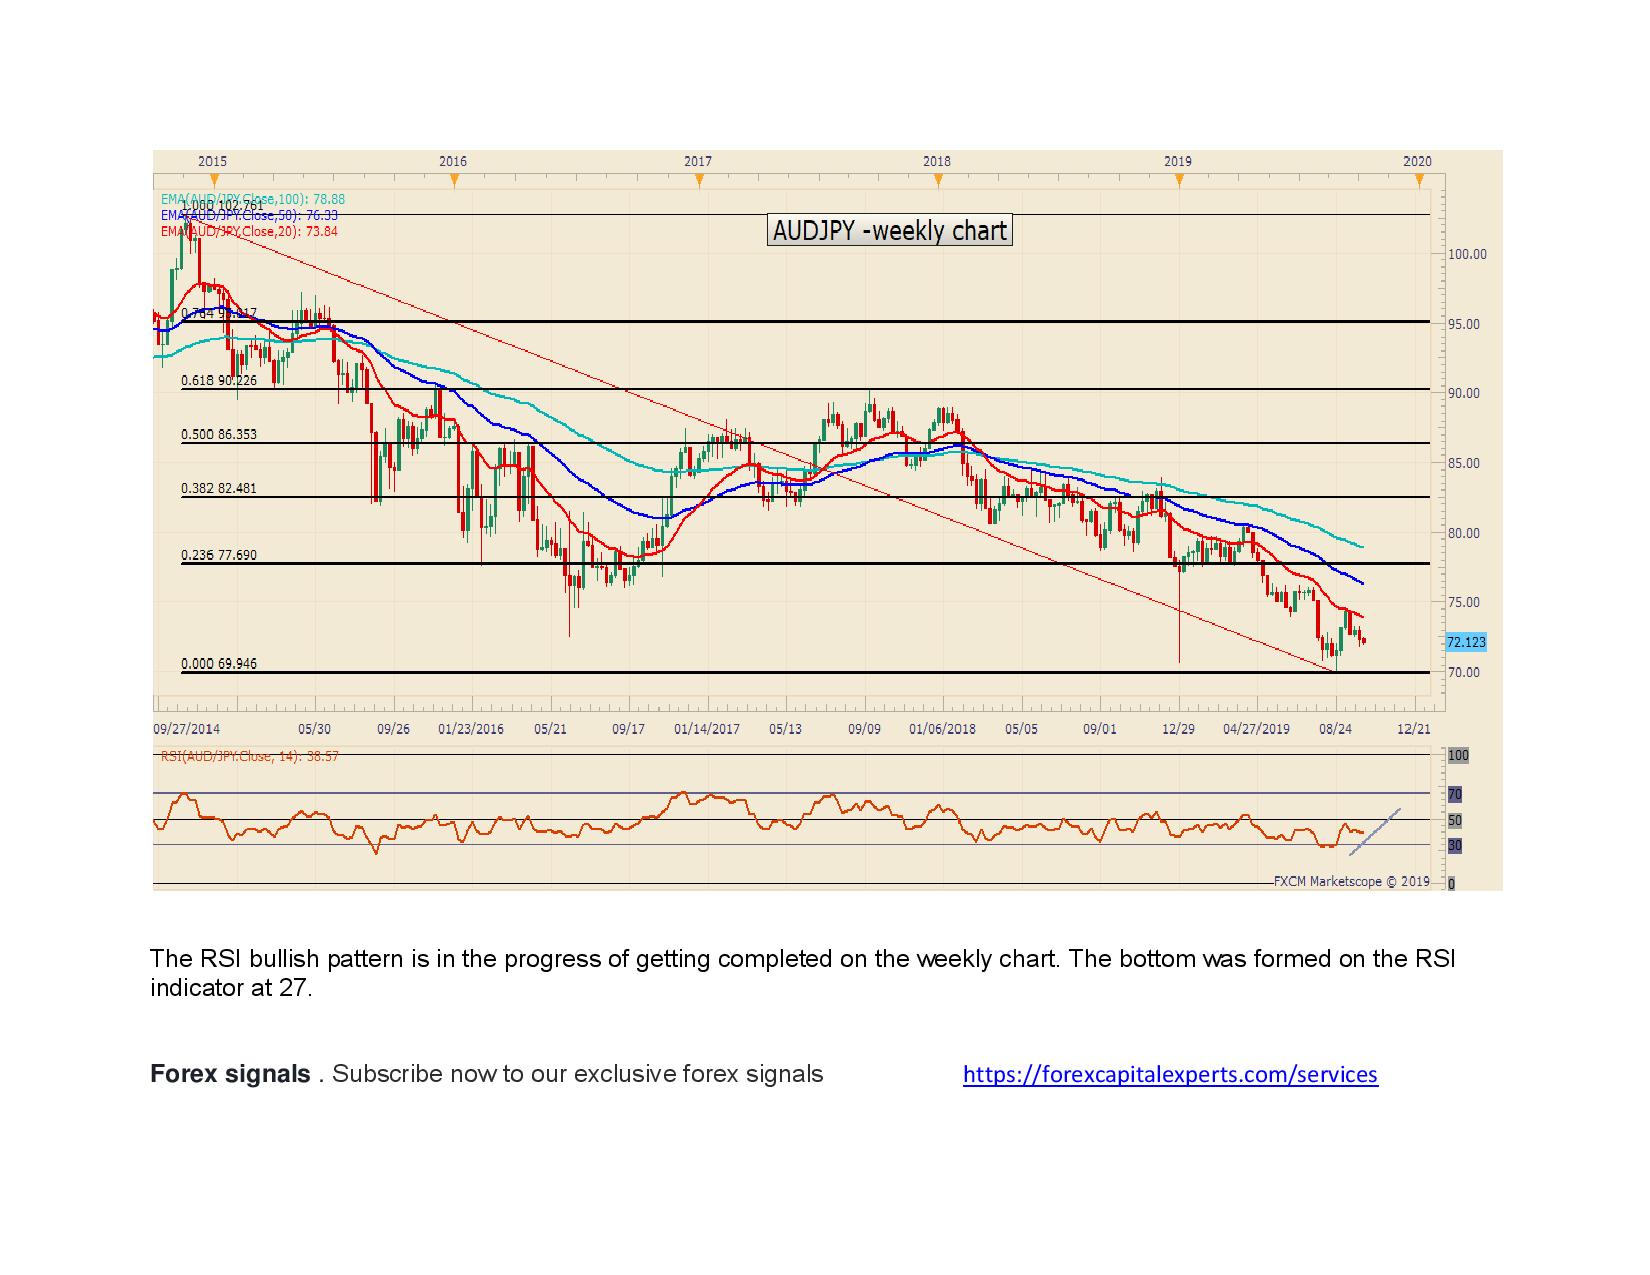
Analysis And Forecast


The MACD uptrend pattern is in the progress of getting completed. The price has already hit EMA 20, EMA 50, and EMA 100, on the daily chart.
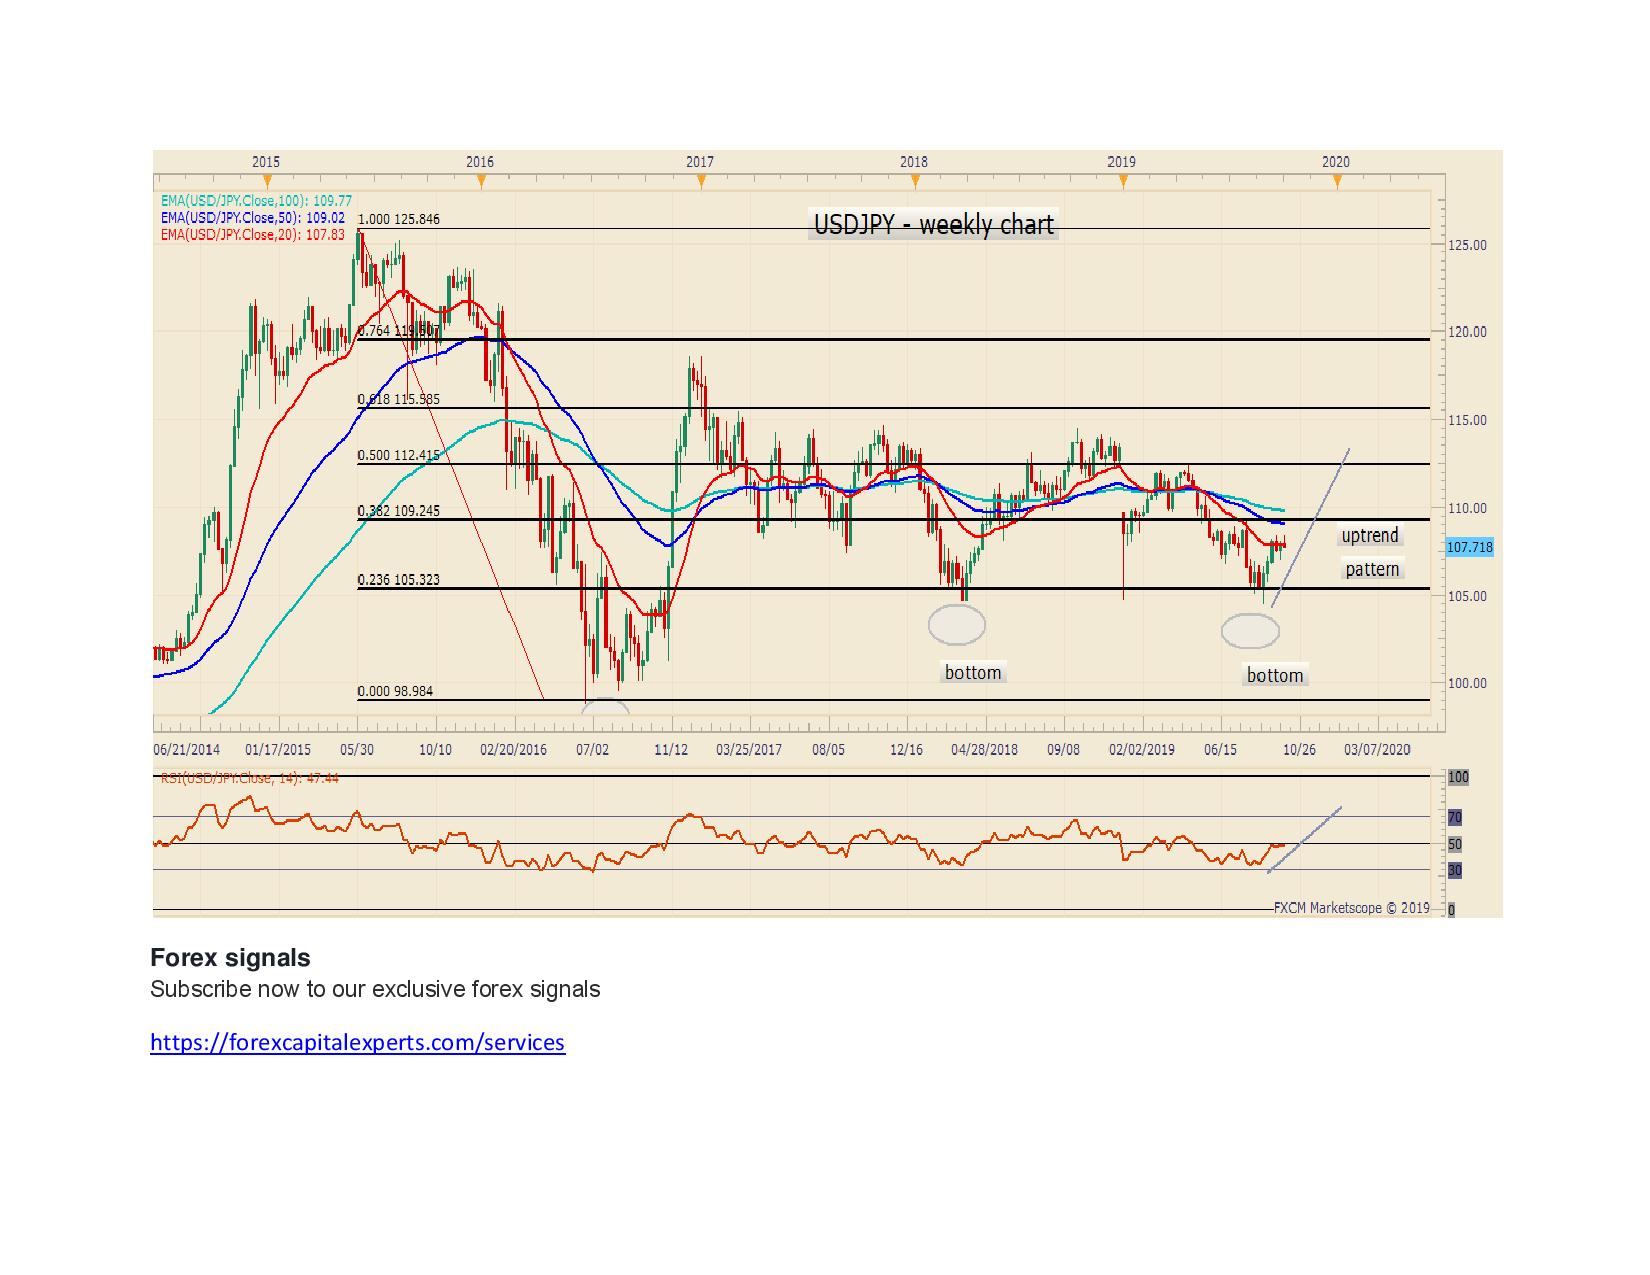
The RSI oscillator might rise to continue its uptrend pattern. The bottom has already been reached for this pair. The USD/JPY price might be 111xx.
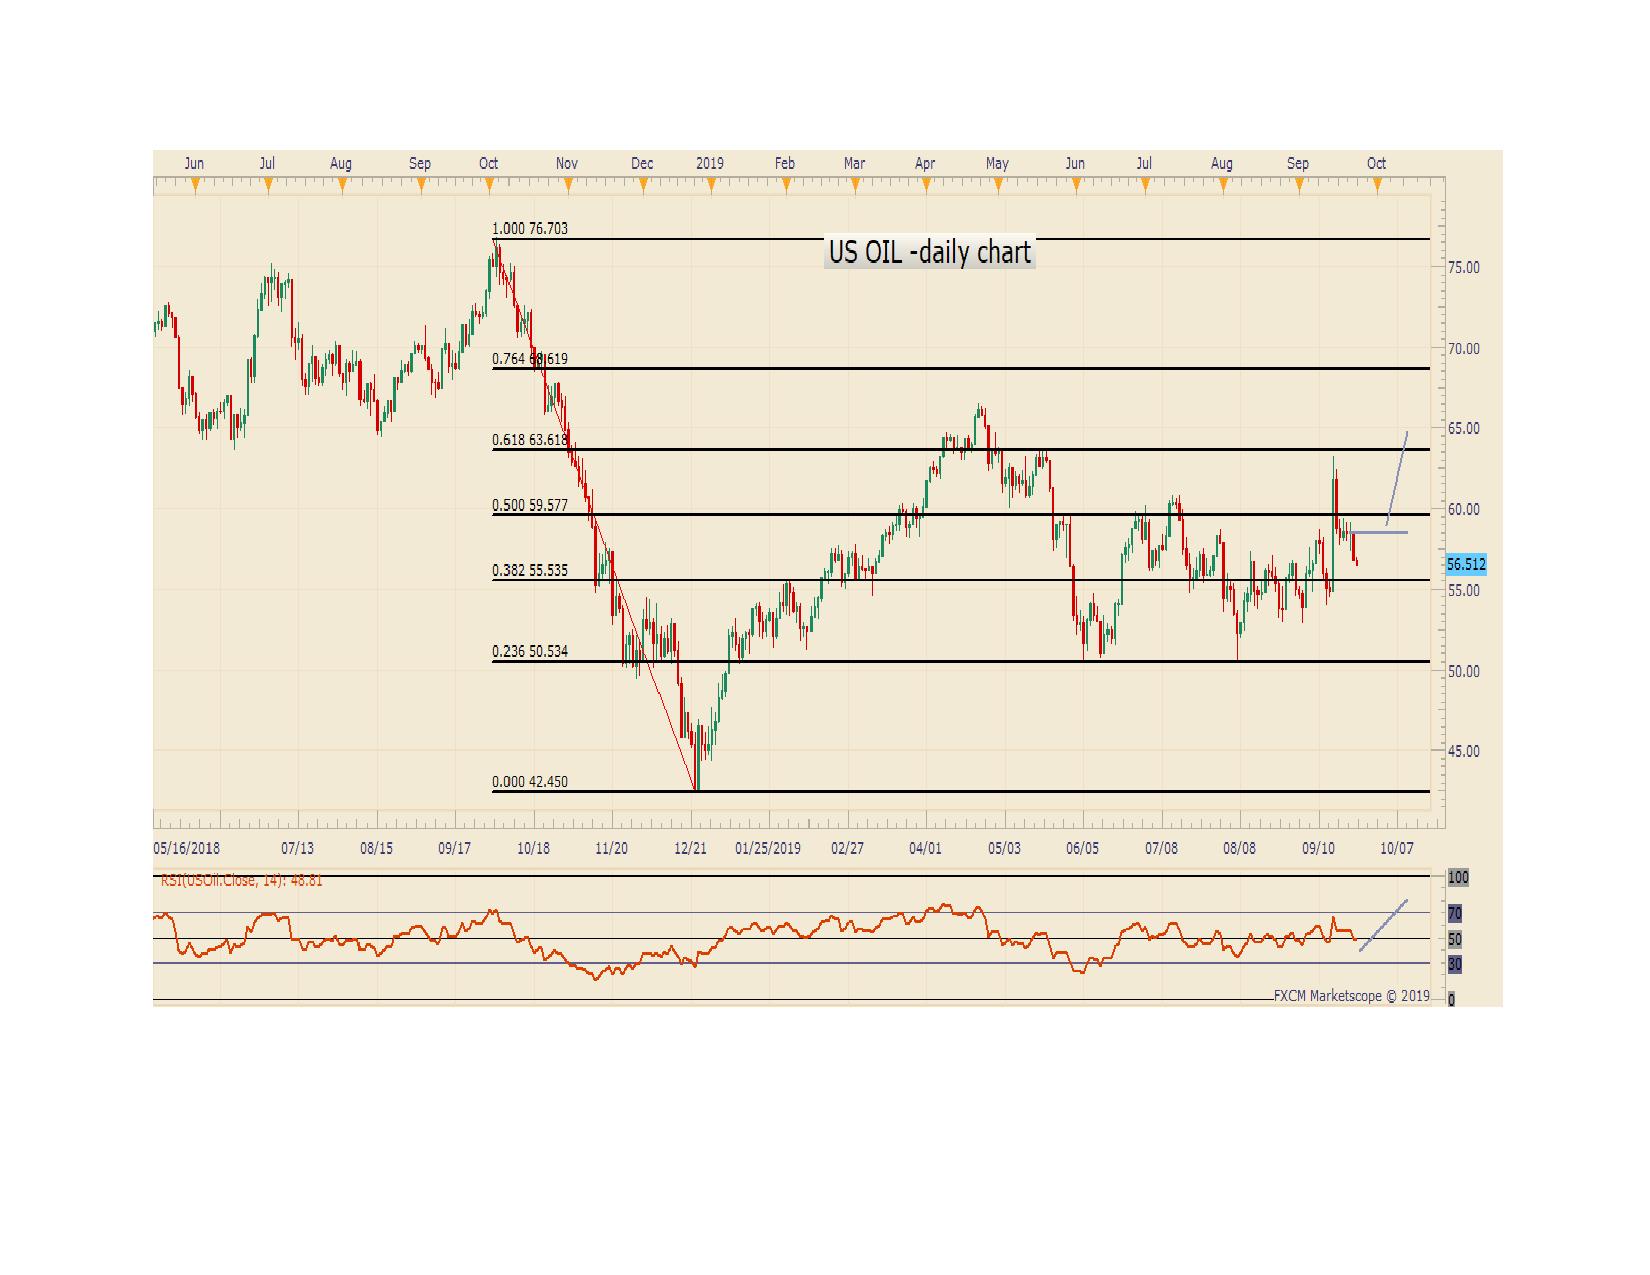
The price of U.S. Oil may rise in the medium term, according to our technical analysis. The RSI oscillator on the daily chart is into a small retracement, but the uptrend might continue in the near term. If the price hits 58.30 level, there is a sign of clear uptrend and the next level will be 63.61 (Fibo 61%).

According to the weekly chart, the price might rise to close the gap at 63.21. The next significant level will be at 66.80. The bullish price pattern and the bullish RSI pattern are in the progress of getting completed. The bottom on the RSI pattern (26) was reached in December last year.
On the daily chart, the uptrend pattern is in the progress of getting completed. The price on the daily chart is still above EMA 20, EMA 50, and EMA 100, and this is a sign of an uptrend.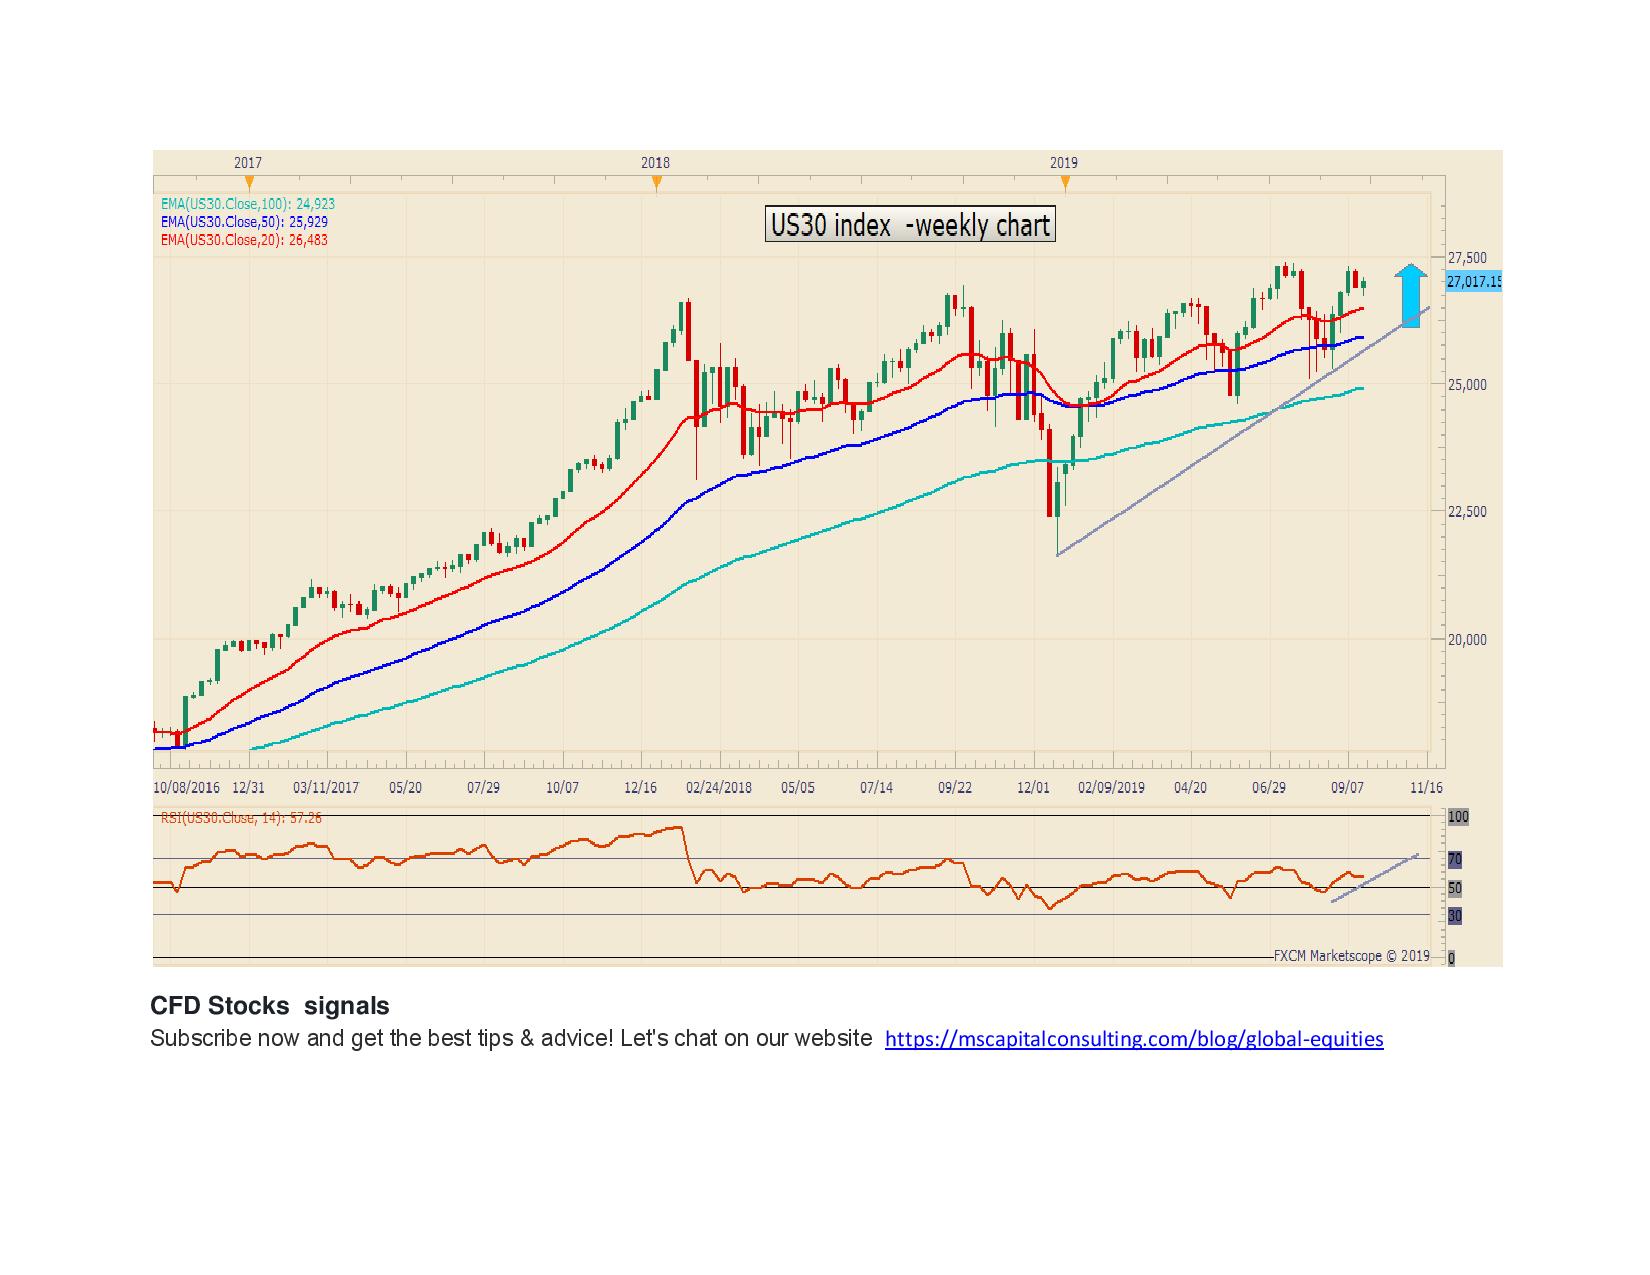
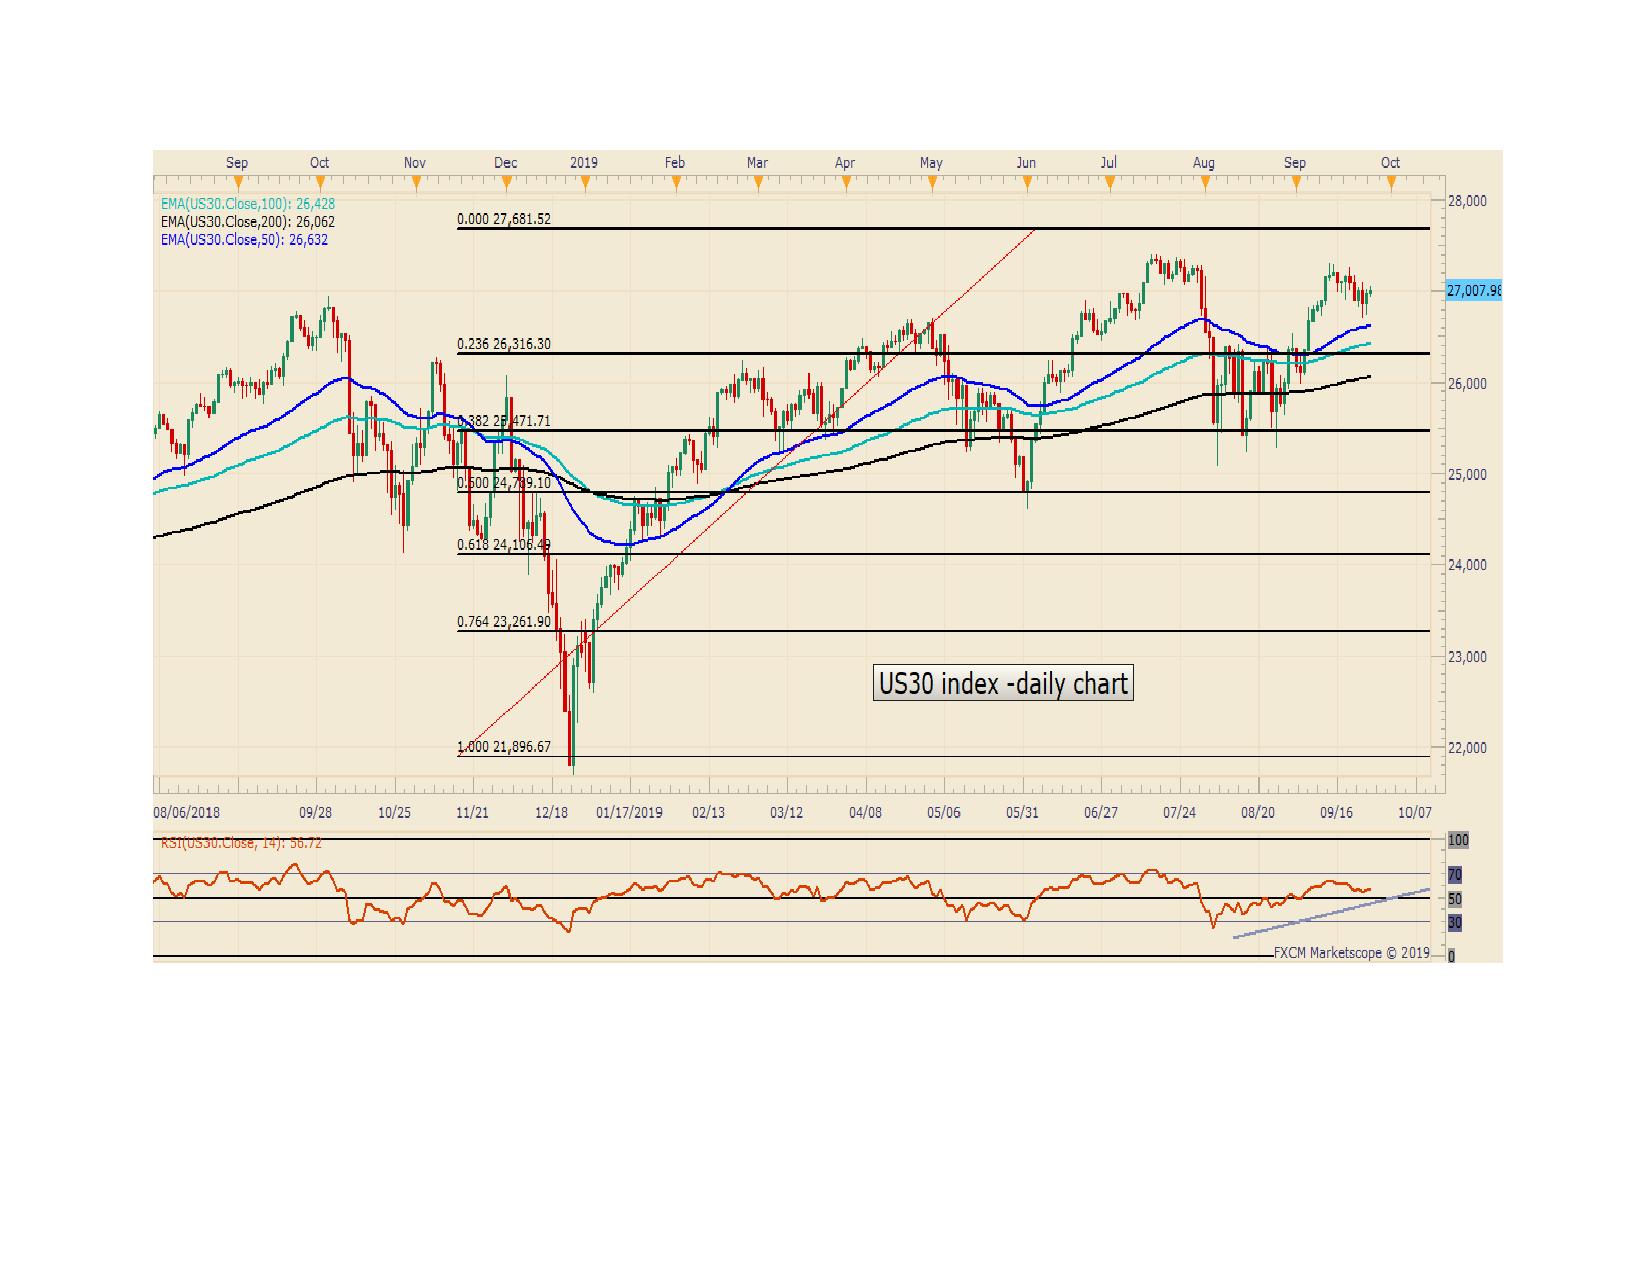
The US 30 index might continue to rise in the near term. According to the weekly chart, the bullish RSI pattern is in the progress of getting completed. Three mini bottoms appear on the price pattern (21643; 24623; 25111).